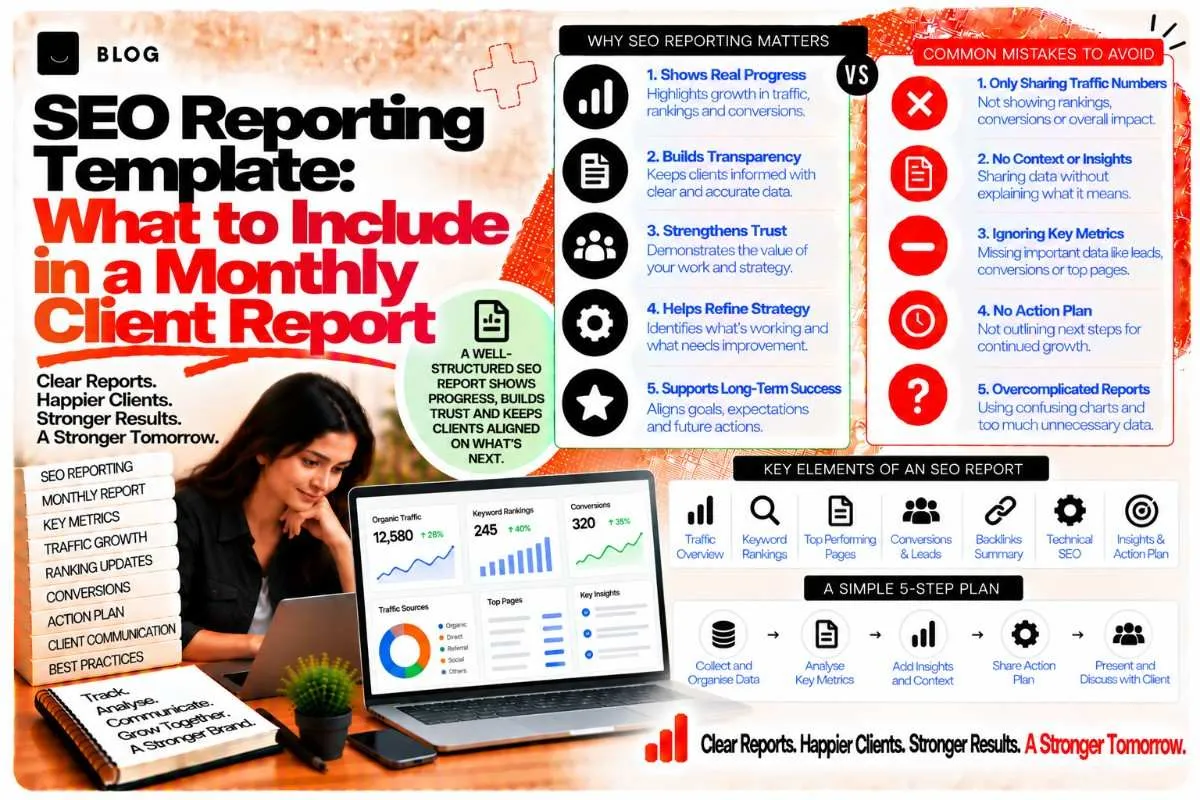
SEO Reporting Template: What to Include in a Monthly Client Report
A monthly SEO report has one job: help the client understand whether the work is moving the business forward and what happens next. Many reports fail that test. They are long exports of rankings and sessions with no explanation, or they focus on the metrics the agency can easily produce rather than the ones the client cares about.
A good report is short enough to read in ten minutes, consistent enough to compare month to month, and honest about what changed and why. It starts from the client's goals, not from the tool's default dashboard.
This guide sets out a reporting structure, the metrics to choose for each goal, where to pull them, and how to write the summary that goes at the top.
Start from the goal, not the dashboard
Before building any report, confirm what the client is trying to achieve. The answer determines what to measure.
- Enquiries or sales from organic search: track conversions, leads and the pages that produce them.
- Brand visibility in a new market: track impressions, branded and non-branded queries, and rankings for priority terms.
- Authority or reputation: track referring domains, brand mentions and review activity.
- Visibility in AI answers: track citations and mentions where they can be measured, with a clear note on the method used.
Most clients have one or two primary goals. Report those first. Everything else sits in a secondary section, or does not appear at all if it does not inform a decision.
Step 1: Set the baseline before the first report
A monthly change means little without a starting point. Before the first report, record:
- Organic clicks, impressions and average position from Search Console, for the last 12 months if available
- Organic sessions, conversions and revenue from GA4, for the same period
- Rankings for the priority keyword list, recorded on a fixed date
- Key pages and their current performance
- Any known technical issues or recent changes to the site
Save the baseline with a date. Every later report compares against it, and it protects both sides if a question arises about what changed.
Step 2: Choose the core metrics
A reporting template should have a small, fixed set of core metrics that appear every month. Too many numbers hide the important ones.
A practical core set:
- Organic clicks and impressions from Search Console, to show search visibility and demand
- Click-through rate, to show how well listings attract clicks
- Average position for priority queries, not the whole site, to show movement on the terms that matter
- Organic conversions and leads from GA4, to show business impact
- Top landing pages by clicks and by conversions, to show what is working
- Indexing status of key pages, to show whether the site is being crawled and indexed
Add metrics only when they inform a decision. A metric that never changes what the client or agency does is clutter.
Step 3: Pull the data consistently
Consistency matters more than sophistication. A report built from the same sources, date ranges and filters each month is far more useful than one that changes every time.
Set rules for:
- Date ranges. Compare the same period in each month, or compare with the previous month and the same month last year, and state which.
- Data sources. Search Console for search data, GA4 for on-site behaviour and conversions. Note any known gaps, such as data thresholds or sampling.
- Filters. Use the same country, device and query filters each time, and state them in the report footnote.
- Rank tracking. Use the same tool, the same keyword list and the same location settings, so the positions can be compared.
Note that Search Console reports rounded and filtered data, and that GA4 attribution differs from last-click models. A short methodology note prevents disputes later.
Step 4: Build the report structure
A reliable structure makes the report quick to read. A common order works well for most clients:
- Summary. Three to five sentences on what changed, what it means, and what happens next.
- Goals and headline numbers. The core metrics against the baseline and the previous month.
- What drove the change. Pages, queries and actions that explain the movement.
- Work completed. A short list of what the agency delivered this month.
- Issues and risks. Anything that needs the client's attention or a decision.
- Next month's plan. Two or three priorities, with owners and dates.
- Methodology. Sources, date ranges and filters.
Keep the work-completed section factual and short. Clients care about results more than activity, so link each action to the metric it was meant to move.
Step 5: Write the summary that people will read
The summary is the part most clients read. Write it last, once the data is complete, and keep it honest.
A useful summary answers three questions:
- What changed? For example, organic conversions rose 18% on the previous month, driven mainly by two service pages.
- Why did it change? Name the likely cause, and say when the cause is uncertain.
- What happens next? Give the one or two actions that follow from the data.
Avoid vague phrases such as "overall performance was positive". Replace them with specific figures and named pages. If results fell, say so, explain what the data suggests, and state what is being done. Clients trust agencies that report declines honestly.
Step 6: Explain movement without overclaiming
Search results move for many reasons: seasonality, competitor changes, algorithm updates, technical fixes and content launches. A report should separate what the agency controlled from what it did not.
Use careful language:
- "Clicks rose after the service page update, and the timing suggests a link" rather than "our update caused the increase"
- "Rankings dipped across the category, which matches a wider shift in results" rather than "we lost rankings"
- "The data does not yet show a clear cause" rather than inventing one
If a change appears to have a technical cause, check it before reporting it. The content freshness post covers when an update is meaningful, and the keyword cannibalization audit post covers when two pages compete for the same query and the report should say so.
Step 7: Report on AI visibility carefully
Clients increasingly ask about visibility in AI answers. Measuring it is harder than measuring rankings, because results vary by system, by user and by time. Be explicit about the method.
If you report AI visibility:
- State the prompts or queries tested, the systems used and the date of each test
- Record results as a sample, not as a universal measure
- Show the change over time from a consistent test set
- Avoid presenting a single screenshot as a trend
Do not promise a specific number of AI citations, because no agency controls those outcomes.
Step 8: Keep the template stable and review it quarterly
Once the structure works, keep it. Changing the format every month makes trends impossible to read. Review the template once a quarter, and ask:
- Does each metric still inform a decision?
- Has the client's goal changed?
- Are any sections the client never reads?
- Is the summary getting the client to act?
Make changes deliberately, and note the date of each change in the report, so comparisons remain valid.
What a report cannot do
A report describes performance. It does not create it. A clear report on a weak strategy still shows a weak strategy, and the agency's value lies in the decisions that follow from the data.
A report also cannot settle every question. Some changes will remain unexplained. Saying so is more credible than offering a neat story the data does not support.
Common reporting mistakes to avoid
Sending a raw export. A table of numbers without a summary forces the client to do the analysis.
Changing the template every month. Trends become impossible to read.
Reporting activity instead of results. A list of tasks completed says little about impact.
Claiming credit for everything. Overclaiming damages trust the first time a result falls.
Using vanity metrics as headlines. Impressions and rankings matter, but they should lead to clicks, leads and revenue.
Skipping the methodology. Without it, a later question about the numbers becomes a dispute.
Frequently asked questions
Aim for a summary on the first page and supporting detail after it. Most clients need a readable report of around five to eight pages, with the summary doing most of the work.
It depends on the goal. For lead generation, conversions and the pages that produce them matter most. For brand visibility, impressions and priority query positions matter more.
Yes, for priority terms, with the method stated. Rankings alone do not show business impact, so pair them with clicks and conversions.
State the drop clearly, show the likely causes the data supports, note what is uncertain, and list the actions and checks under way.
A live dashboard helps the client check progress between reports. The written report still matters, because it provides the interpretation the dashboard cannot.
You can automate the data pulls. The summary and the interpretation should remain human, because the value lies in judging what the numbers mean.
Ready to build what's next?
Tell us where you're headed. We'll come back with a plan to get there.
Book an intro call